Smarter Shipping Decisions with Business Intelligence

Book a Call call_made
Marine/Shipping Industry Sweden
About Client

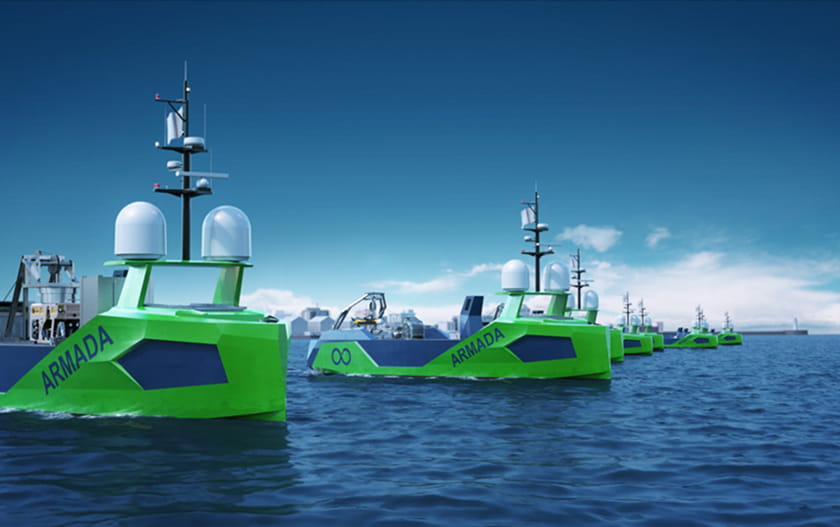
Ocean Infinity is a leading marine robotics and offshore technology company specializing in advanced ocean data acquisition, vessel operations, and subsea exploration services. With a globally distributed fleet and data-driven operational ecosystem, the organization focuses on improving efficiency, safety, and decision-making through innovative digital solutions and intelligent maritime technologies.

Core Challenges

Data Integration

Shipping companies face challenges managing large amounts of data. Historical data is downloaded from websites, converted into CSV files, and organized. To ensure timeliness and stability, an incremental refresh mechanism optimizes API data management.

Real-time Data Processing

Realtime monitoring for efficient vessel planning, route optimization and cargo handling is needed in the context of shipping operations. For processing large real-time data creates aggregated data pipelines and efficient query

Predictive Analytic

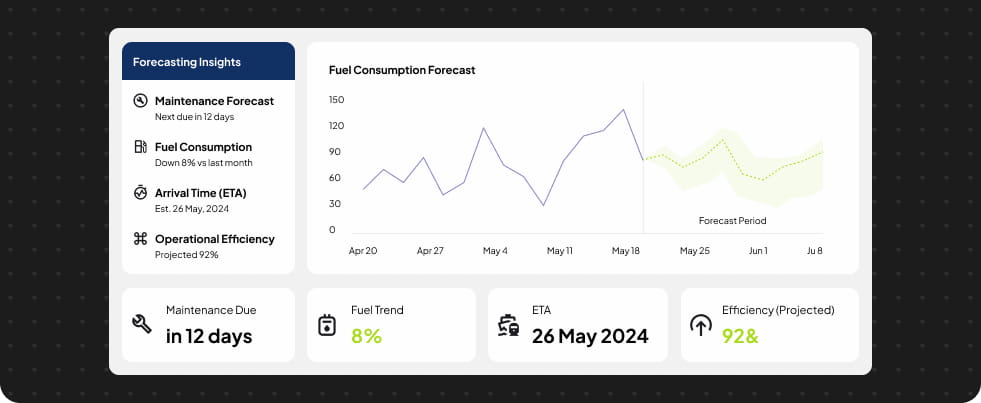
We utilize line chart forecasting, incorporating streamlined historical data to predict vessel performance, maintenance needs, fuel consumption, and arrival times. This is crucial for optimizing operations and reducing costs.

Regulatory Compliance

Shipping industry faces regulatory requirements concerning safety, security, emissions, and environmental protection. Incorporating regulatory compliance metrics in Power BI reports.

Data Security and Privacy

For enhanced security, we implement Row Level Security (RLS) to filter sensitive data such as vessel positions, cargo details, and customer data based on specific criteria, ensuring confidentiality and protection.

Core Challenges

Shipping companies face challenges managing large amounts of data. Historical data is downloaded from websites, converted into CSV files, and organized. To ensure timeliness and stability, an incremental refresh mechanism optimizes API data management.

Realtime monitoring for efficient vessel planning, route optimization and cargo handling is needed in the context of shipping operations. For processing large real-time data creates aggregated data pipelines and efficient query

We utilize line chart forecasting, incorporating streamlined historical data to predict vessel performance, maintenance needs, fuel consumption, and arrival times. This is crucial for optimizing operations and reducing costs.

Shipping industry faces regulatory requirements concerning safety, security, emissions, and environmental protection. Incorporating regulatory compliance metrics in Power BI reports.

For enhanced security, we implement Row Level Security (RLS) to filter sensitive data such as vessel positions, cargo details, and customer data based on specific criteria, ensuring confidentiality and protection.

Solution
1

Intelligent Shipping Data Infrastructure

2

Advanced Analytics & Visualization

Solution
1

Intelligent Shipping Data Infrastructure

Unified Data Integration

Integrated historical CSV datasets and live API feeds into a centralized dashboard environment with incremental refresh capabilities for optimized performance, stability, and real-time operational visibility.

Secure & Controlled Data Access

Implemented advanced filtering, slicers, and Row Level Security (RLS) to enable role-based data visibility, improve navigation, and ensure secure access to critical shipping information.

2

Advanced Analytics & Visualization

Predictive Performance Forecasting

Leveraged forecasting-enabled line charts to analyze historical vessel data and predict maintenance schedules, fuel consumption trends, operational efficiency, and estimated arrival timelines.

Interactive Embedded Reporting

Developed visually rich and interactive dashboards with industry-focused charts that can be seamlessly embedded into custom applications and websites for wider accessibility and decision-making support.

Integration

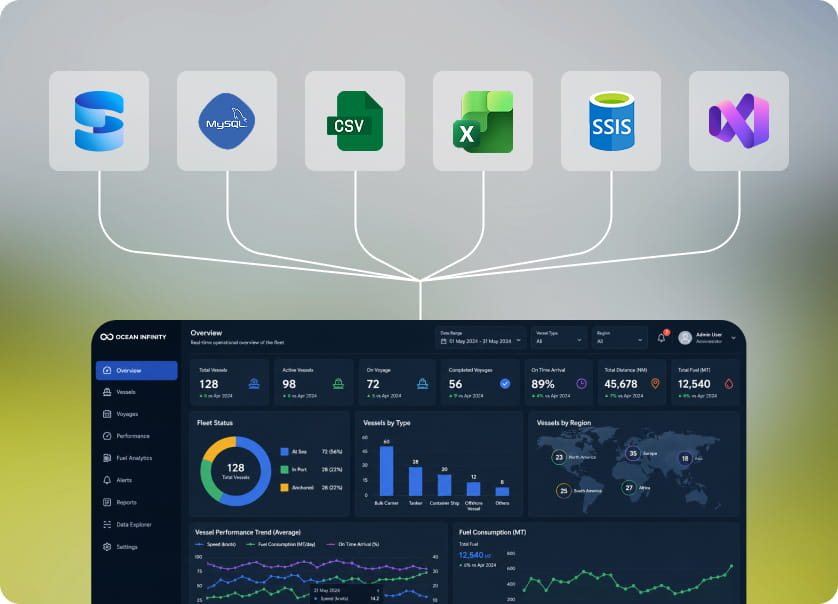
Equipped with a variety of data source. 

Integration enables organizations to streamline processes, improve data accessibility, enhance decision-making, and create more efficient workflows. To create this report, we have leveraged the following integration capabilities:

  • SQL Server
  • Web
  • CSV Files
  • APIs
  • Shared Cloud Storage
Customization

How we played with charts.

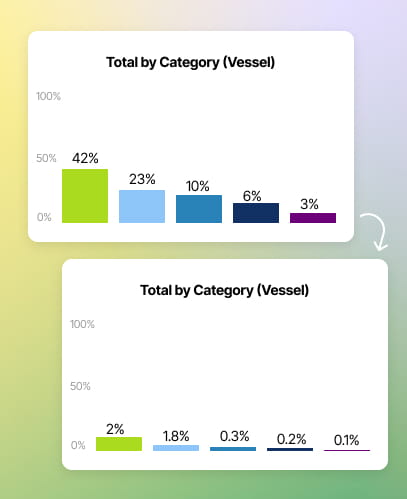
We didn't just add the charts; we made them special to show data better, making sure each chart looks just right for its purpose.

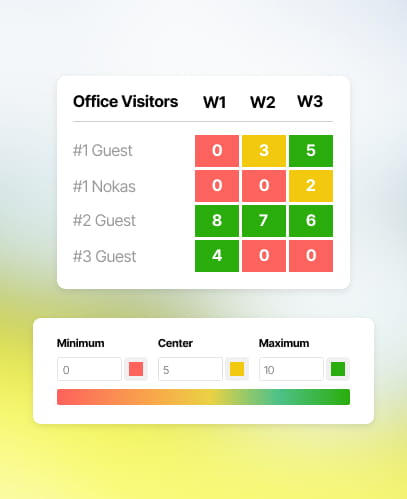
Condition Formatting

Dynamic modifications such as changing the background colors of rows based on specific conditions.

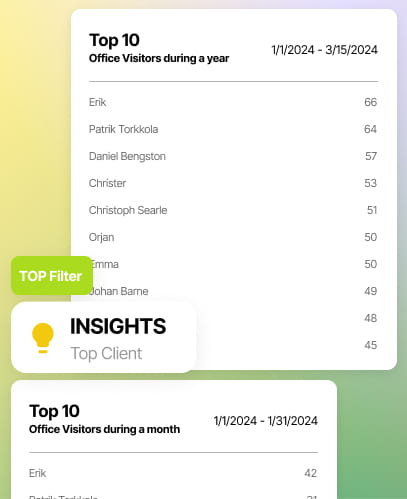
TOP Filter

Offered insights into top clients for both the current period and overall period.

Drill-Down

Incorporated hierarchical structures into drill-down functionalities for enhanced understanding.

Page Navigation

Provided seamless page navigation with filter application to navigate through selected data subsets.

Enhancement by adding useful features.

Bookmarks

Dynamic chart views through bookmarks, enabling users to seamlessly switch between different chart representations based on the selection of actionable buttons, all within the same canvas.

Tooltip

Tooltip have been strategically utilized to provide detailed analysis information, maintaining proper filter context for enhanced insights.

Page and Report Level Filters

Utilized both Page and Report Level Filters, users can now filter pages and visuals according to specific requirements, ensuring a tailored viewing experience.

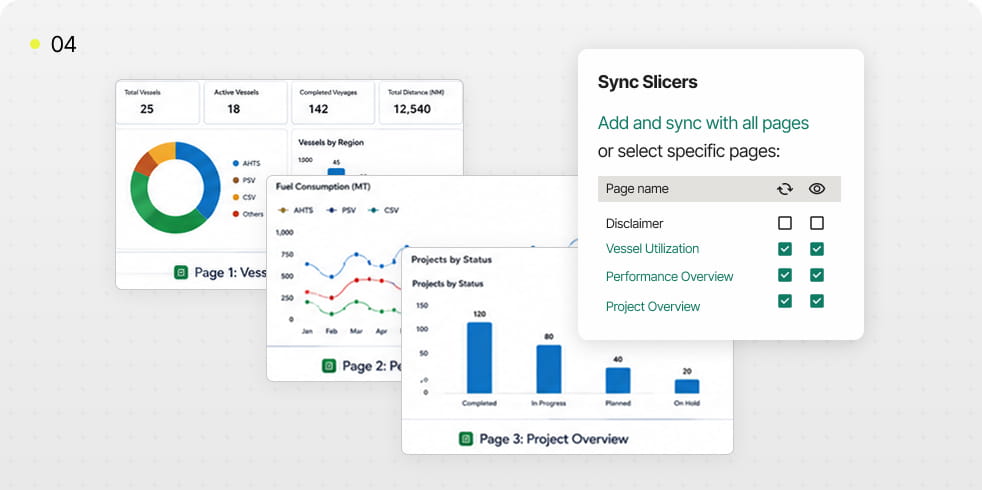
Synchronizing slicer

Synchronized slicers across all pages, users can effortlessly navigate through the data while maintaining consistent filtering across different visualizations, facilitating a well organised analytical journey.

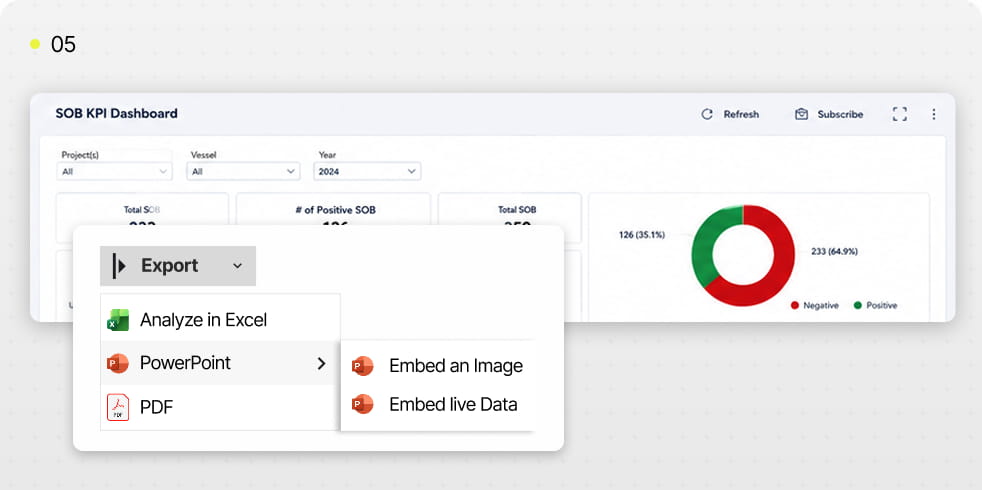
Embedded the report

Embed the report into the web application, making it easily accessible and seamlessly integrated into the user's workflow. This empowers users to access and interact with the report directly within the application environment, enhancing usability and accessibility.

Explore more. Additional features.

Implementing Scheduled Data Refreshes

This report's implementation of schedule data refresh ensures that the shipping information is regularly updated, maintaining its relevance and accuracy over time. 

Customized UI

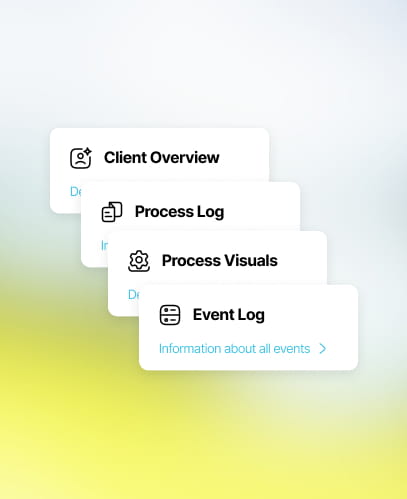
To enhance accessibility and functionality for the shipping industry, it was necessary to refine the visual layout, incorporating intuitive navigation components and optimizing interactive features for smoother user engagement.

Key Performance Indicators

Incorporated a diverse array of Key Performance Indicators (KPIs) tailored to systematically evaluate and boost the efficiency, effectiveness, and overall performance of shipping operations.

Case Studies

Global Impact Through Expert Healthcare Software Development Solutions

PHP
My SQL
SCORM
OAuth 2.0

Enterprise Analytics & E-Learning Platform for Healthcare Operations

FinThrive is a leading Revenue Cycle Management (RCM) solution provider in the U.S. healthcare sector, offering cutting-edge, AI-powered services across claims processing, patient access, and revenue recovery. It helps healthcare organizations increase revenue, reduce costs, expand cash collections, enhance patient financial experience and ensure regulatory compliance with advanced, scalable technology.

Read Case Study arrow_right_alt
Power BI

Food and Beverage Dashboard

KFC is one of the world’s most recognized quick-service restaurant brands, known for delivering quality food experiences across global markets. For its Dubai operations, the focus was on strengthening data-driven decision-making through smarter reporting and operational visibility. To support this, a tailored Power BI solution was implemented to transform complex business data into clear visual […]

Read Case Study arrow_right_alt
Ext JS
Telerik UI
ASP.NET Core
SQL

Catalog Digitization Solution for Marks & Spencer

Marks & Spencer (M&S) is one of the United Kingdom’s most iconic retail brands, renowned for its premium clothing, home, and food offerings. With a legacy spanning over a century, M&S operates across multiple global markets and serves millions of customers through its physical stores and digital platforms. The company places strong emphasis on innovation, […]

Read Case Study arrow_right_alt
.NET Core
Azure OpenAI
Azure AI Search
SQL Server
Azure Cloud

Al-Powered Collaboration & Support Platform for Healthcare Labs

Vastian is the leading provider of healthcare and laboratory quality, compliance, and accreditation solutions, powering laboratories and hospitals to achieve better clarity and show their higher standards. Our single, configurable integrated platform delivers a standardized, centralized solution that automates quality and compliance tasks and is fully customizable. With Vastian, health systems and labs can get […]

Read Case Study arrow_right_alt
Power Bi
SQL
Snowflake

HR Analytics & Workforce Insights Dashboard

L’Oréal is one of the world’s leading beauty brands, recognized for its extensive portfolio across skincare, haircare, makeup, and professional beauty products. With a large global workforce and operations spanning multiple regions, the company places strong emphasis on innovation, people development, and data-driven decision-making. To strengthen workforce visibility and strategic HR planning, L’Oréal sought a […]

Read Case Study arrow_right_alt

Build smarter from day one.
Get expert guidance on scope, timelines, and investment.

Get an Estimate call_made