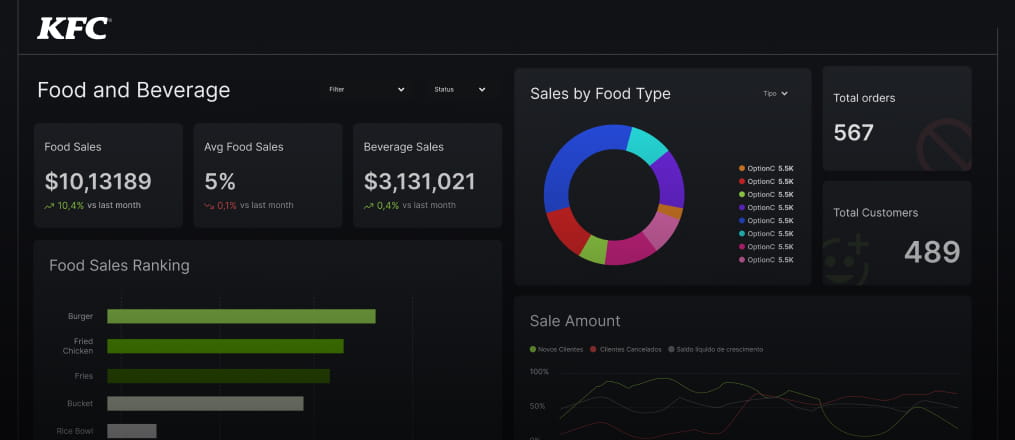
Food and Beverage Dashboard

Book a Call call_made
Food and Beverage (F&B) Dubai
About Client

KFC is one of the world’s most recognized quick-service restaurant brands, known for delivering quality food experiences across global markets. For its Dubai operations, the focus was on strengthening data-driven decision-making through smarter reporting and operational visibility. To support this, a tailored Power BI solution was implemented to transform complex business data into clear visual insights, improve forecasting accuracy, monitor quality metrics in real time, and uncover market trends that help drive faster, more informed business decisions.

Core Challenges

Data Variety

Food and Beverage companies deal with a wide range of data types including sales figures, production data, supply chain information, customer feedback, quality control metrics, and regulatory compliance data. Utilize the Power Query Editor to transform and cleanse raw data from various sources before loading it into Power BI datasets.

Supply Chain Complexity

The food supply chain is complex, involving multiple stages from sourcing raw materials to manufacturing, distribution, and retail. Implement data pipelines to automate the extraction, transformation, and loading (ETL) of supply chain data into Power BI datasets on a regular basis.

Seasonal Demand

Seasonal fluctuations in demand are common in the food and beverage industry due to factors such as holidays, weather patterns, and cultural events. Power BI to build predictive logic that forecasts future demand based on historical trends and external factors.

Competition and Market Trends

The industry is highly competitive, with rapidly changing consumer preferences and market trends. Integrate market research data and competitor analysis into Power BI to identify emerging trends and consumer preferences. 


Customer Engagement and Loyalty

Building and maintaining customer loyalty is crucial for success in the food and beverage industry. Implemented personalized marketing campaigns based on insights derived from customer data analysis within Power BI.

Data Quality and Integration

Data quality issues such as inconsistency, incompleteness, and inaccuracies are common in large datasets. Utilize data profiling and cleansing capabilities in Power BI to standardize data formats, remove duplicates, and enhance data quality before analysis

Adaptable Heading and Data Values

Implementing dynamic changes in headings and data values based on filtering actions can be a difficulty. So, we have created measures to handle these dynamic adjustments effectively.

Core Challenges

Food and Beverage companies deal with a wide range of data types including sales figures, production data, supply chain information, customer feedback, quality control metrics, and regulatory compliance data. Utilize the Power Query Editor to transform and cleanse raw data from various sources before loading it into Power BI datasets.

The food supply chain is complex, involving multiple stages from sourcing raw materials to manufacturing, distribution, and retail. Implement data pipelines to automate the extraction, transformation, and loading (ETL) of supply chain data into Power BI datasets on a regular basis.

Seasonal fluctuations in demand are common in the food and beverage industry due to factors such as holidays, weather patterns, and cultural events. Power BI to build predictive logic that forecasts future demand based on historical trends and external factors.

The industry is highly competitive, with rapidly changing consumer preferences and market trends. Integrate market research data and competitor analysis into Power BI to identify emerging trends and consumer preferences. 


Building and maintaining customer loyalty is crucial for success in the food and beverage industry. Implemented personalized marketing campaigns based on insights derived from customer data analysis within Power BI.

Data quality issues such as inconsistency, incompleteness, and inaccuracies are common in large datasets. Utilize data profiling and cleansing capabilities in Power BI to standardize data formats, remove duplicates, and enhance data quality before analysis

Implementing dynamic changes in headings and data values based on filtering actions can be a difficulty. So, we have created measures to handle these dynamic adjustments effectively.

Solution
1

Turning Complex Data into Clear Visual Insights

2

Real-Time Decisions with Predictive Insights

Solution
1

Turning Complex Data into Clear Visual Insights

Tailored Data Visualization Approach

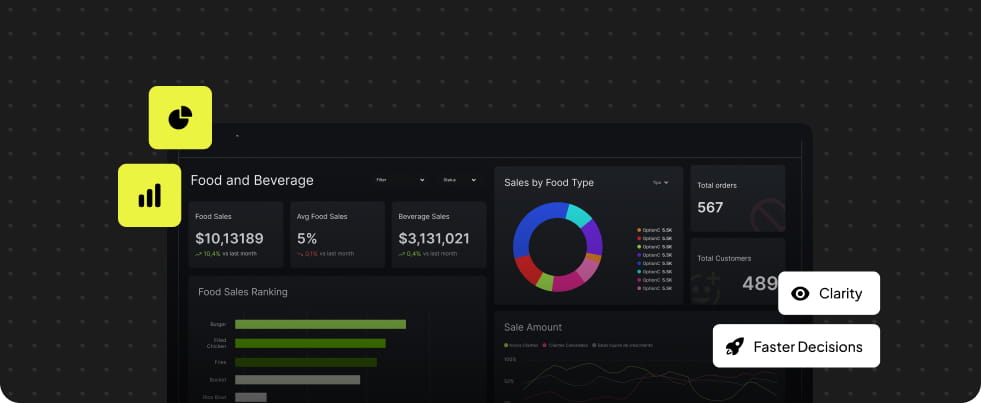
We developed an advanced data visualization tool designed to simplify complex operational data into intuitive, easy-to-understand visuals. With a curated set of industry-specific charts, the solution enhances clarity and enables faster, more informed decision-making for professionals.

Structured Data Modelling System

Robust data modelling capabilities were implemented to efficiently structure and organize integrated datasets. This ensures seamless analysis, improved data relationships, and a strong foundation for accurate reporting.

2

Real-Time Decisions with Predictive Insights

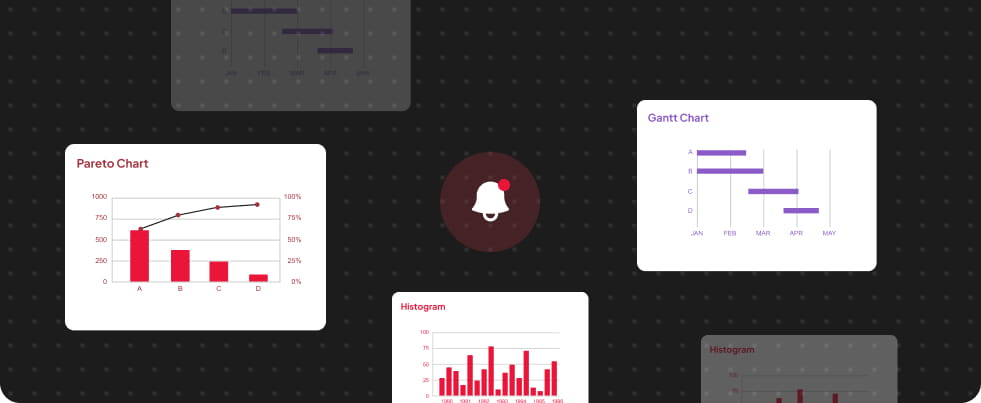
Real-Time Alert Notifications System

We built intelligent alert logic using DAX to highlight deviations from quality standards in real time. These alerts are visually emphasized in bold red formats, ensuring immediate attention and faster response to critical issues.

Forecasting & Market Trend Insights

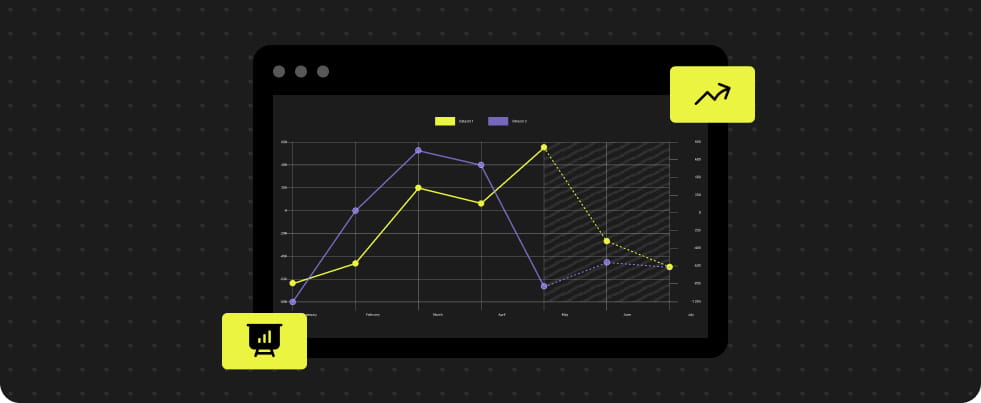
Predictive models within Power BI were developed to anticipate seasonal demand based on factors like holidays, weather, and promotions. Additionally, market research and competitor data were integrated to uncover emerging trends and evolving consumer preferences.

Integration

Equipped with a variety of supply chain data.

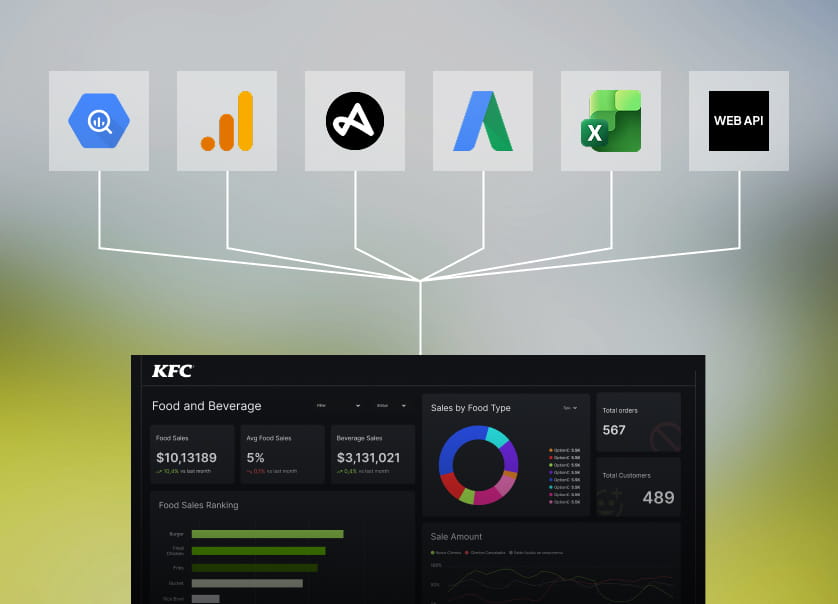
Integration in the food and beverage industry involves data from various origins, including inventory databases, point-of-sale applications, supplier APIs, or spreadsheets, and harmonizing them into a unified system. To create this report, we've leveraged the following integration capabilities

  • Google BigQuery
  • Google Analytics
  • Adjusts
  • AdWord
  • CSV and Excel Files
  • Web APIs
Customization

How we played with charts.

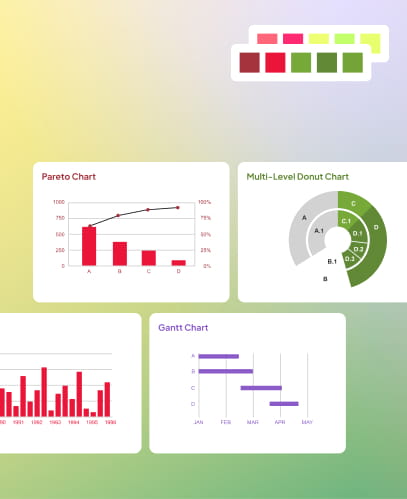
In crafting our data visualizations for the food and beverage industry, we didn't simply incorporate standard charts; we tailored them to uniquely suit the industry's needs. Each chart has been designed to enhance data clarity and relevance, ensuring that every visual representation serves its specific purpose effectively within the food and beverage sector.

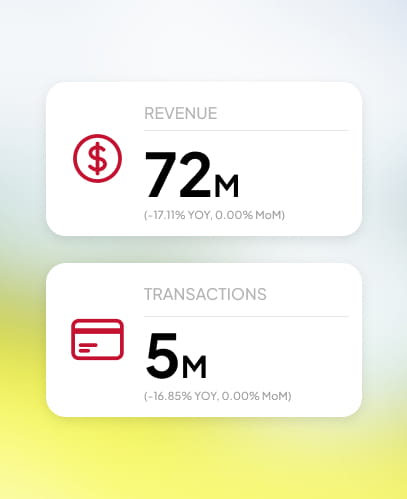
Custom Card

To create a custom card, incorporate both text and multiple values, and add symbols for a unique design.

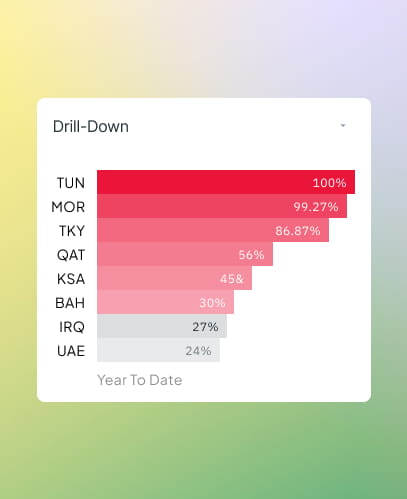
Drill-Down

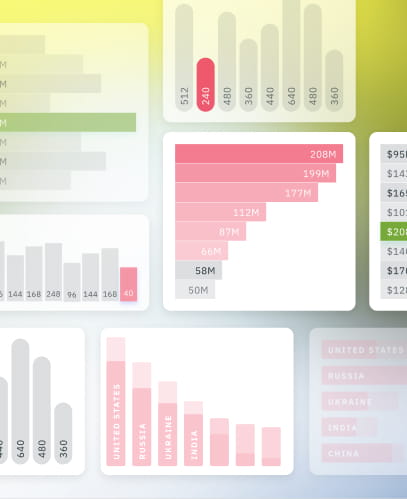
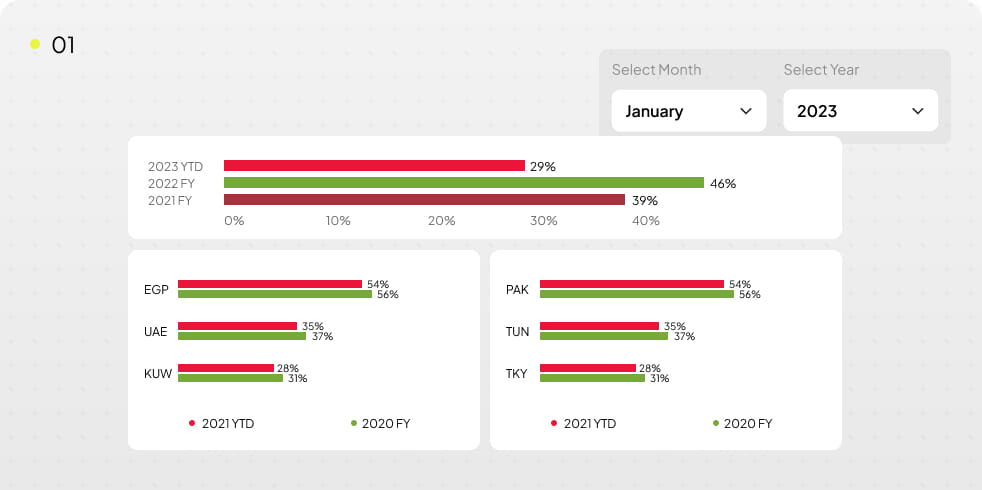
In the bar chart, we have added hierarchy, wherein one axis represents countries, and within each country, clusters have been included.

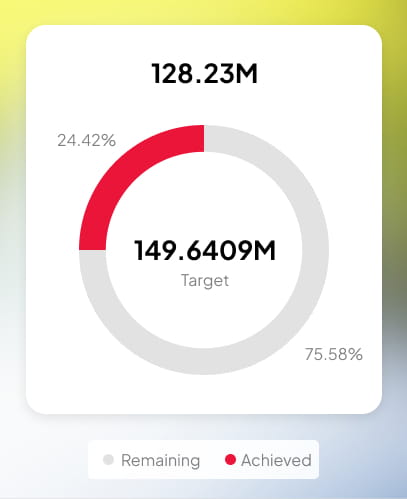
Custom Donut

Created a donut chart featuring a target in the centre and archived surrounding it, with the remaining fields appropriately colours.

Dynamic Title

We developed a logic system to dynamically change the title based on various parameters or conditions, ensuring adaptability and relevance in different contexts.

Using Theme-Based colours

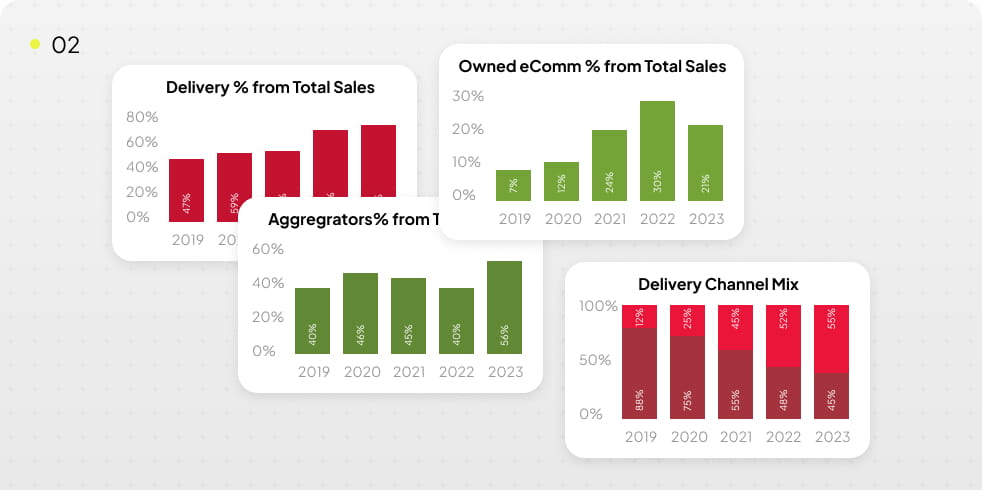
We used theme-based colours in the report design to establish a distinctive visual identity, ensuring each visual stands out while maintaining consistency.

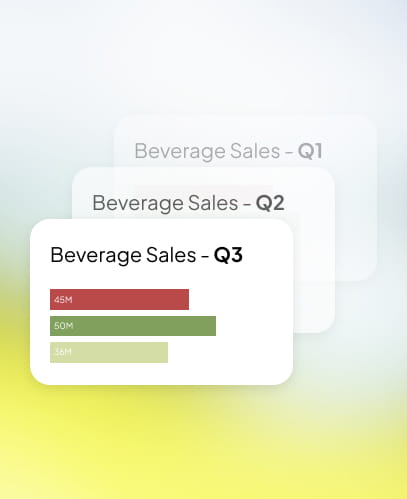
Simple Data Labelling for Sales Analysis

All the bar and column charts in the report have data labelling enabled to ensure that the current year's sales by segment and sub-segment are easily understood.

Enhancement by adding useful features.

Disconnected Calendar Table

By connecting measures to the disconnected calendar table, calculate year-to-date totals for various sales.

Customize Shape of the Visuals 

We tailored the shape of the visuals to align precisely with specific requirements, ensuring they seamlessly integrate into the overall design aesthetic and effectively convey the intended message. 

Explore more. Additional features.

KPIs and Objectives

Our Power BI report systematically evaluates and enhances the effectiveness, efficiency, and overall performance of food and beverage operations by seamlessly integrating a wide range of key performance indicators (KPIs).

Role-Based Security

Used role-based security to limit user access to sensitive information and make sure they are only shown content that is important to their roles and responsibilities inside the company.

Modified Formatting

Used conditional formatting techniques to dynamically highlight significant data points in complex datasets can improve understanding and clarity.

Unique Theme

Created a distinctive custom theme that combined the brand's identity, making sure the UI was branded consistently all the way through.

Case Studies

Global Impact Through Expert Healthcare Software Development Solutions

PHP
My SQL
SCORM
OAuth 2.0

Enterprise Analytics & E-Learning Platform for Healthcare Operations

FinThrive is a leading Revenue Cycle Management (RCM) solution provider in the U.S. healthcare sector, offering cutting-edge, AI-powered services across claims processing, patient access, and revenue recovery. It helps healthcare organizations increase revenue, reduce costs, expand cash collections, enhance patient financial experience and ensure regulatory compliance with advanced, scalable technology.

Read Case Study arrow_right_alt
Ext JS
Telerik UI
ASP.NET Core
SQL

Catalog Digitization Solution for Marks & Spencer

Marks & Spencer (M&S) is one of the United Kingdom’s most iconic retail brands, renowned for its premium clothing, home, and food offerings. With a legacy spanning over a century, M&S operates across multiple global markets and serves millions of customers through its physical stores and digital platforms. The company places strong emphasis on innovation, […]

Read Case Study arrow_right_alt
.NET Core
Azure OpenAI
Azure AI Search
SQL Server
Azure Cloud

Al-Powered Collaboration & Support Platform for Healthcare Labs

Vastian is the leading provider of healthcare and laboratory quality, compliance, and accreditation solutions, powering laboratories and hospitals to achieve better clarity and show their higher standards. Our single, configurable integrated platform delivers a standardized, centralized solution that automates quality and compliance tasks and is fully customizable. With Vastian, health systems and labs can get […]

Read Case Study arrow_right_alt
Power BI

Food and Beverage Dashboard

KFC is one of the world’s most recognized quick-service restaurant brands, known for delivering quality food experiences across global markets. For its Dubai operations, the focus was on strengthening data-driven decision-making through smarter reporting and operational visibility. To support this, a tailored Power BI solution was implemented to transform complex business data into clear visual […]

Read Case Study arrow_right_alt
Power Bi
SQL
Snowflake

HR Analytics & Workforce Insights Dashboard

L’Oréal is one of the world’s leading beauty brands, recognized for its extensive portfolio across skincare, haircare, makeup, and professional beauty products. With a large global workforce and operations spanning multiple regions, the company places strong emphasis on innovation, people development, and data-driven decision-making. To strengthen workforce visibility and strategic HR planning, L’Oréal sought a […]

Read Case Study arrow_right_alt

Build smarter from day one.
Get expert guidance on scope, timelines, and investment.

Get an Estimate call_made